Respirometry notes 3/20/2021
New aluminum chambers
We had these respirometry chambers made by the ASU machine shop, based on the similar ones designed by Sable to use with their peltier-effect heating/cooling plate. The chambers are made from aluminum, have barbed fittings to attach tubing, there is a path through the top so that the incurrent air can thermally equilibrate, a cylindrical cavity to hold the insect, and two threaded caps which tighten onto an O-ring and which have glass windows to allow insertion of a pair of infrared emitter and detector.

Aluminum chamber on pelt plate
With a pair of three-way valves, the respirometry airstream can be directed either into the chamber or diverted to flow around it (to offer a baseline).
Before using these, I had to reconfigure our old AD2, removing the static LED elements from the circuit board and attaching ones on cables so that they can be inserted into either end of the chamber. It worked!
Sample activity trace
ggplot(dd, aes(x=Seconds, y=Volts)) + geom_vline(xintercept=c(127, 238, 605), col="red") + geom_rect(aes(ymin=-Inf, ymax=Inf, xmin=0, xmax=127), fill="grey95", alpha=0.1) + geom_rect(aes(ymin=-Inf, ymax=Inf, xmin=605, xmax=Inf), fill="grey95", alpha=0.1) + geom_path(size=0.5) + theme_bw()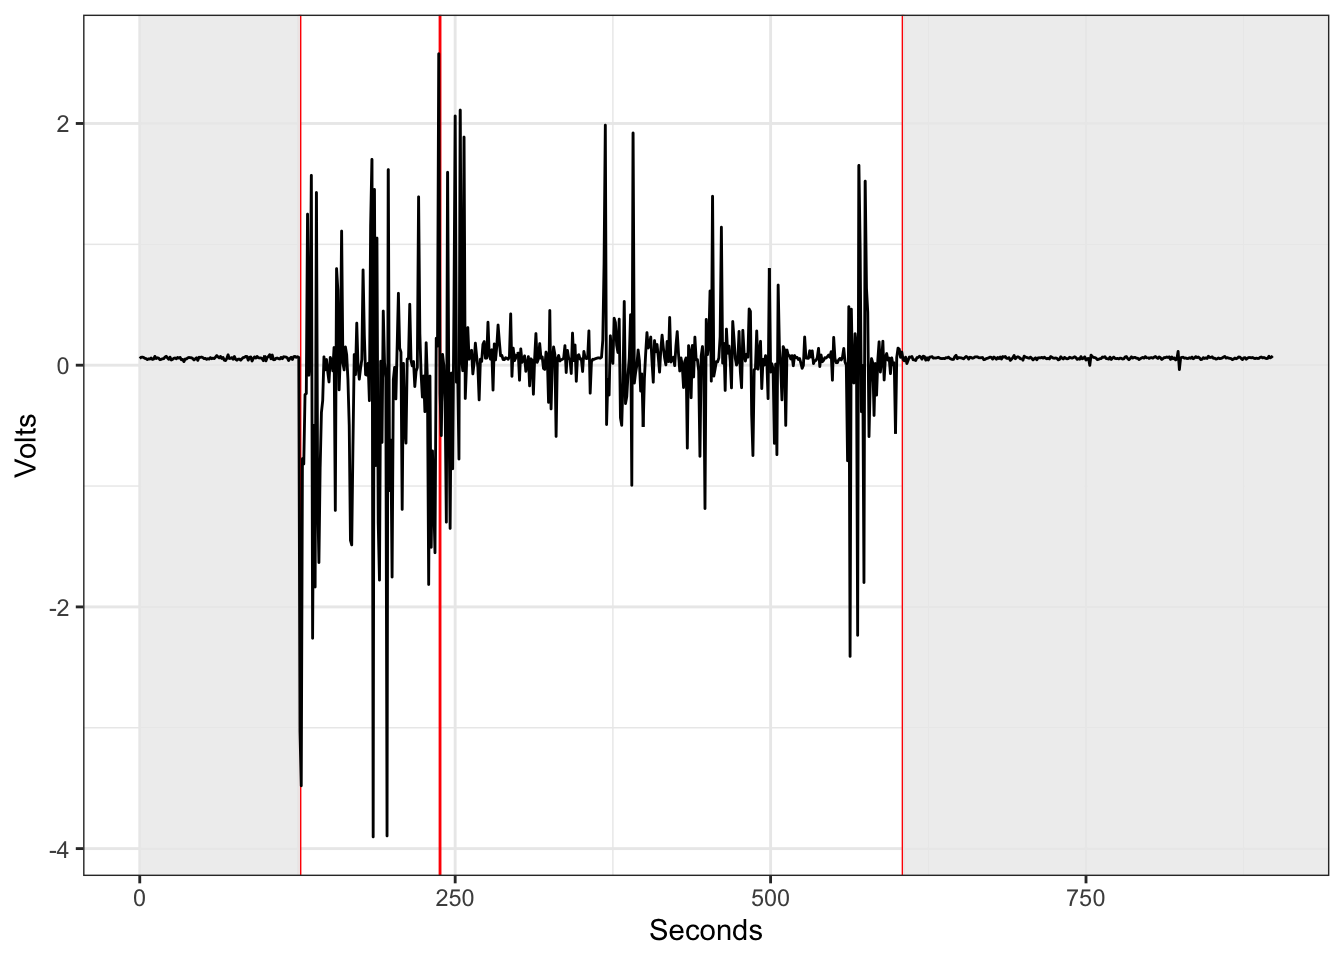
Figure 1: Fruit fly activity (baseline - chamber - baseline)
Testing out the new respirometry chamber
I was measuring the metabolic rate of a tick and happened to realize that the the CO2 reading from the baseline air stream (0 ppm) did not match the CO2 reading from an empty aluminum chamber (~ 0.8 ppm).
This was puzzling because as far as I could tell, the chamber appeared well sealed and should’ve been airtight. Either something inside was producing CO2 or room air was diffusing into the chamber.
Taking a look at the data (note that I paused the recording for about a minute when switching between baseline/chamber paths to purge/washout any accumulated CO2):
ggplot(c1, aes(x=Seconds, y=CO2_Li7k)) + geom_rect(aes(ymin=-Inf, ymax=Inf, xmin=-Inf, xmax=t1[1]), fill="grey98", alpha=0.1) + geom_rect(aes(ymin=-Inf, ymax=Inf, xmin=t1[2], xmax=Inf), fill="grey98", alpha=.1) + geom_path(size=0.5) + geom_vline(xintercept=t1, col="grey50", size=0.1) + geom_path(size=0.5, col="red") + theme_bw() + ylab(bquote(~CO[2]~'concentration (ppm)'))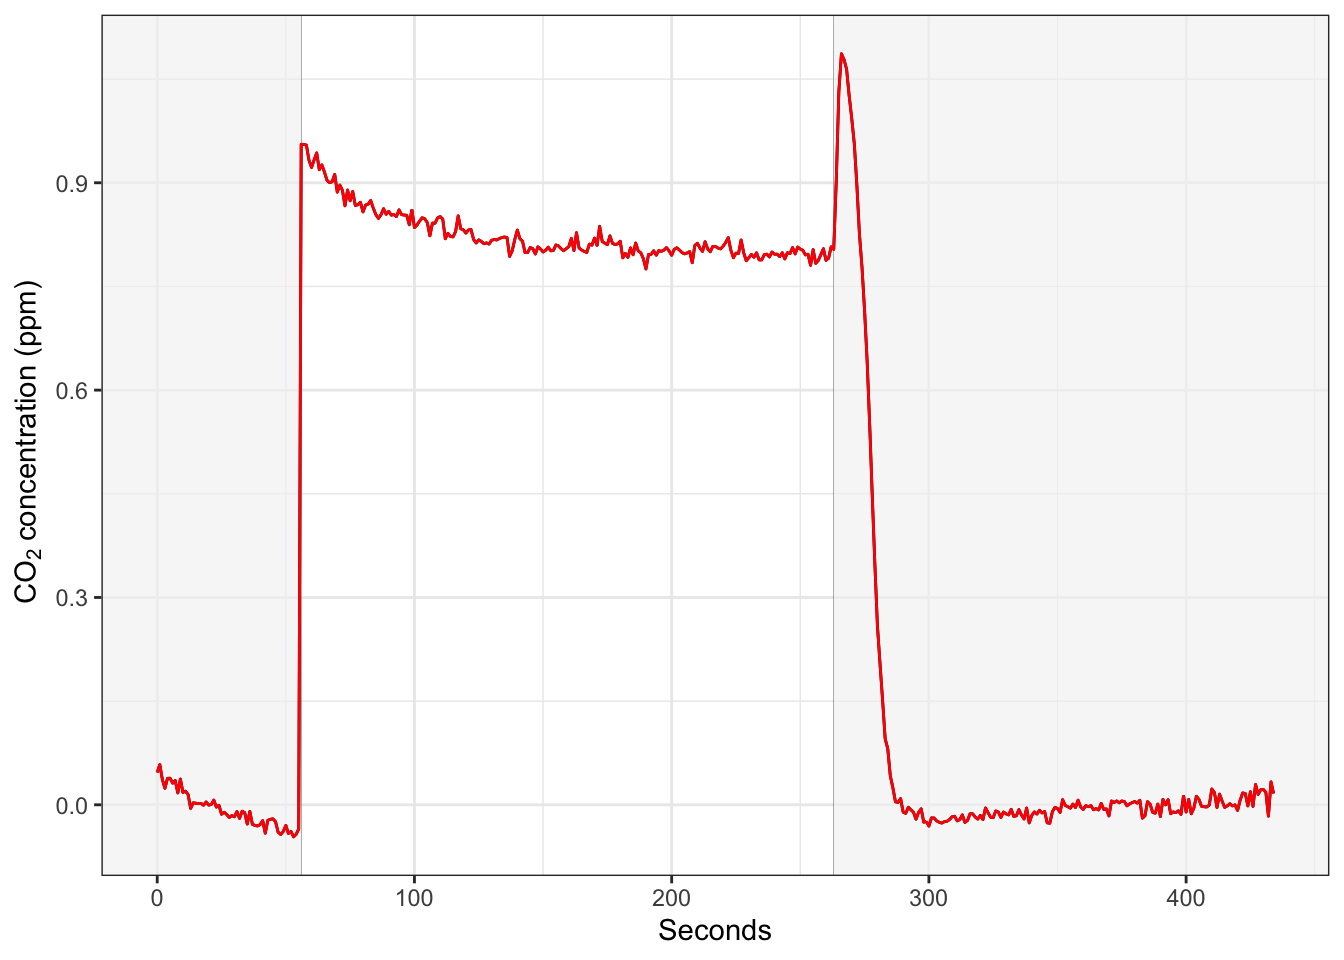
Figure 2: Empty aluminum chamber
I checked a different kind of chamber (a simple tube design used with the MAVEn) and found that compared to the baseline, it only had a very slight elevation of 0.08 ppm while empty and in use, indicating a slight leak, but much smaller than with our new chambers.
ggplot(c2, aes(x=Seconds, y=CO2_Li7k)) + geom_rect(aes(ymin=-Inf, ymax=Inf, xmin=-Inf, xmax=t2[1]), fill="grey98", alpha=0.1) + geom_rect(aes(ymin=-Inf, ymax=Inf, xmin=t2[2], xmax=Inf), fill="grey98", alpha=.1) + geom_path(size=0.5) + geom_vline(xintercept=t2, col="grey50", size=0.1) + geom_path(size=0.5, col="red") + theme_bw() + ylab(bquote(~CO[2]~'concentration (ppm)')) 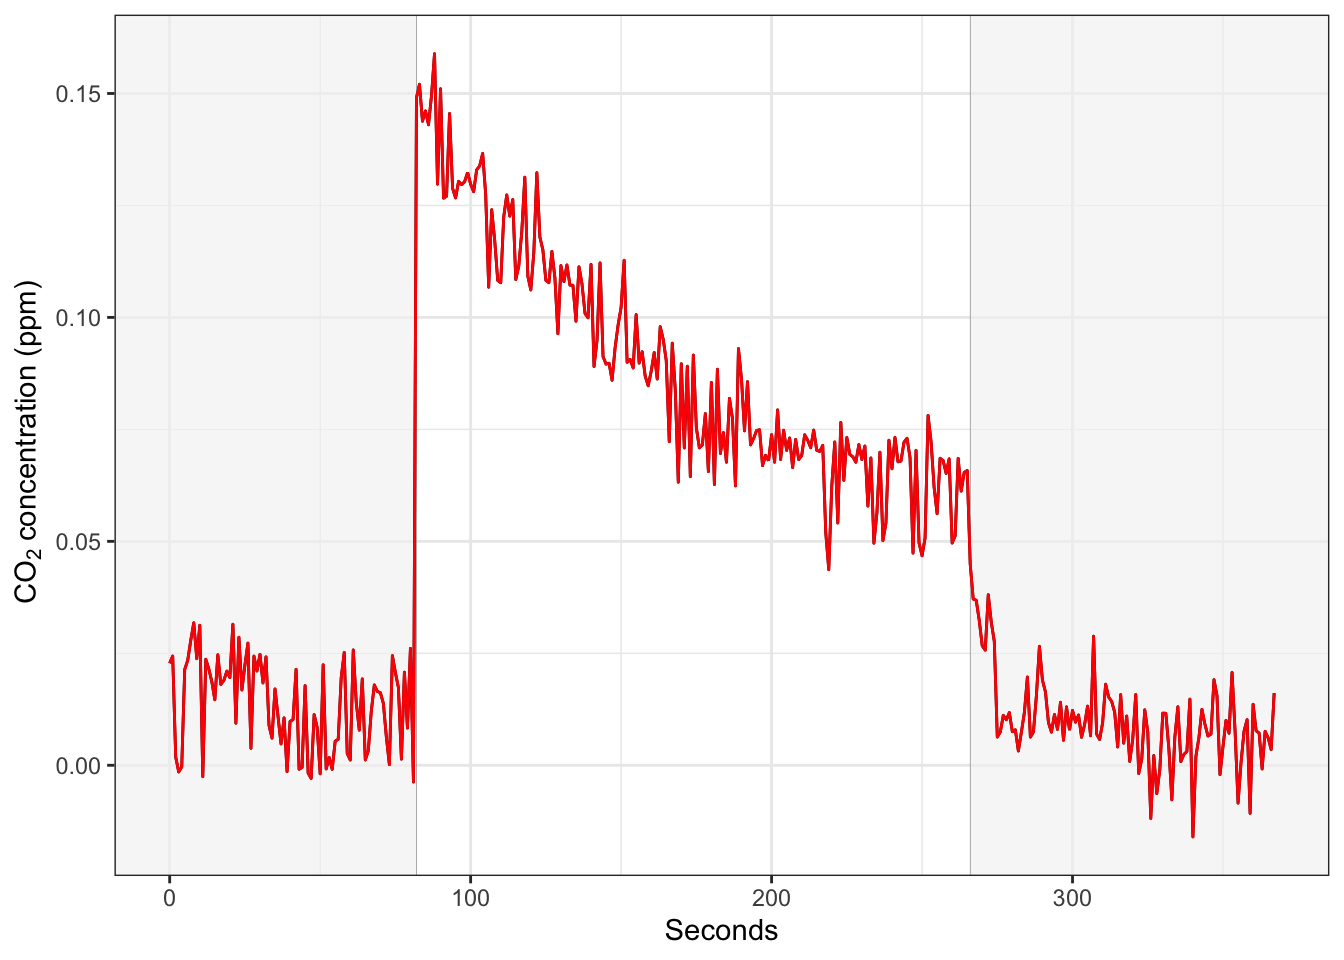
Figure 3: Empty plastic vial chamber
Both had some leak, but look at the y-axis limits, it’s a pretty trivial amount in the plastic vial chamber and about an order of magnitude greater in the aluminum chamber.
Looking for the leak
We removed the top plate and put a very thin layer of silicone vacuum grease on the surface to help make a more airtight seal.

Looking for a leak in the chamber
Repeating the same trial as before with an empty chamber…
ggplot(c3, aes(x=Seconds, y=CO2_Li7k)) + geom_rect(aes(ymin=-Inf, ymax=Inf, xmin=-Inf, xmax=t3[1]), fill="grey98", alpha=0.1) + geom_rect(aes(ymin=-Inf, ymax=Inf, xmin=t3[2], xmax=t3[3]), fill="grey98", alpha=0.1) + geom_rect(aes(ymin=-Inf, ymax=Inf, xmin=t3[4], xmax=Inf), fill="grey98", alpha=.1) + geom_path(size=0.5) + geom_vline(xintercept=t2, col="grey50", size=0.1) + geom_path(size=0.5, col="red") + theme_bw() + ylab(bquote(~CO[2]~'concentration (ppm)')) 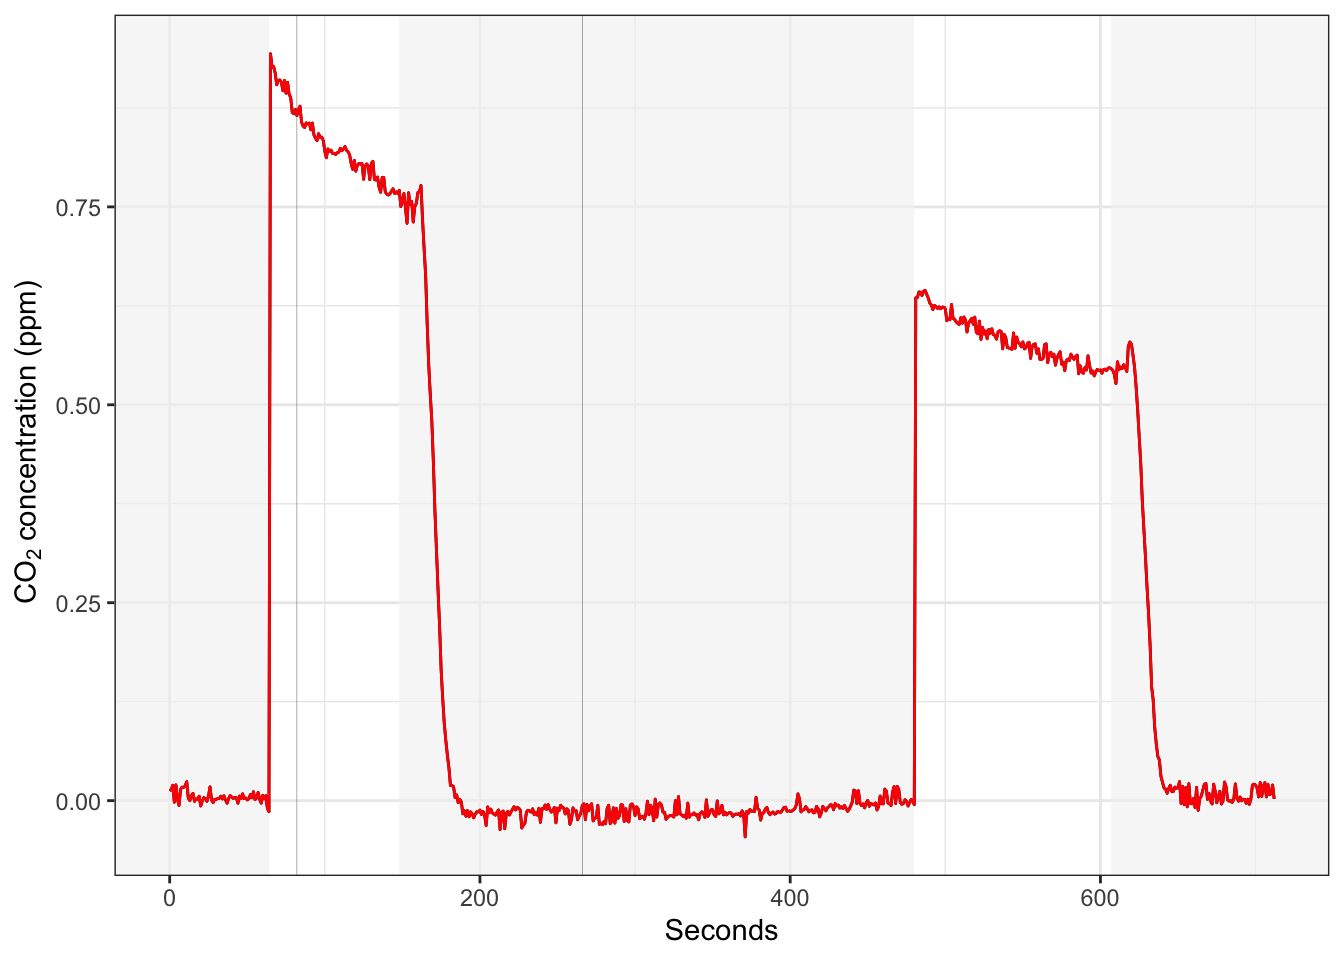
Figure 4: Empty aluminum chamber with vacuum grease; two readings with baselines between
I ran another trial in which I alternated between measuring the baseline and chamber paths, but leaving the chamber sealed for increasing periods of time (45 s, 83 s, and 284 s). There appeas to be a strong correlation between the duration the chamber was sealed and the amount of CO2 that had accumulated within, as evidenced by the size of the CO2 washout peak.
ggplot(c5, aes(x=Seconds, y=CO2_Li7k)) + geom_rect(aes(ymin=-Inf, ymax=Inf, xmin=0, xmax=t5[1]), fill="grey98", alpha=0.1) + geom_rect(aes(ymin=-Inf, ymax=Inf, xmin=t5[2], xmax=t5[3]), fill="grey98", alpha=.1) + geom_rect(aes(ymin=-Inf, ymax=Inf, xmin=t5[4], xmax=t5[5]), fill="grey98", alpha=.1) + geom_path(size=0.5) + geom_vline(xintercept=t5, col="grey50", size=0.1) + geom_path(size=0.5, col="red") + theme_bw() + ylab(bquote(~CO[2]~'concentration (ppm)'))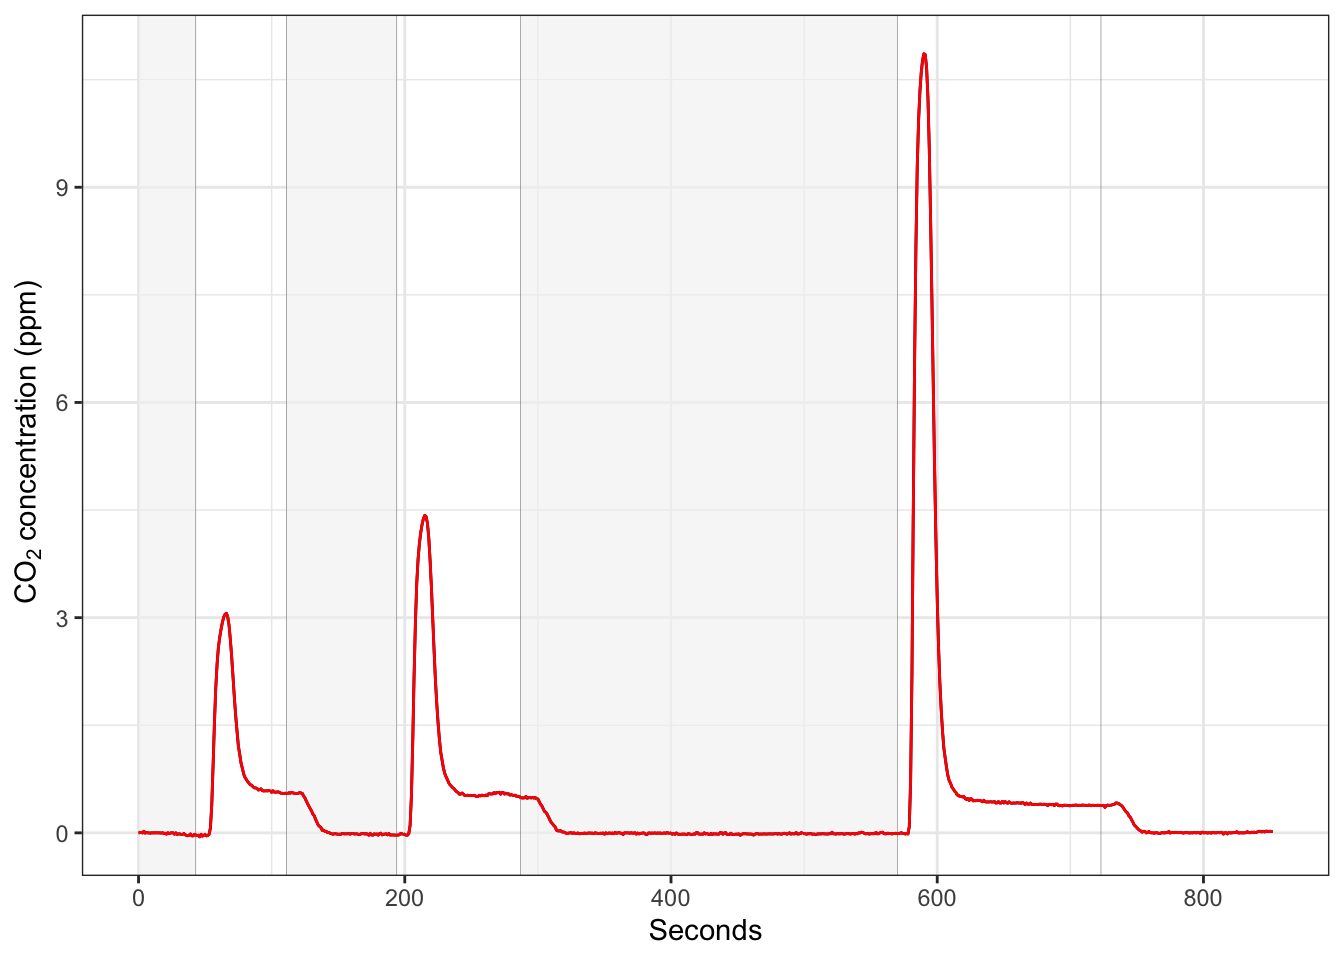
Figure 5: Alternating series of baseline and empty chamber with full washout traces
So, not really any resolution here. A few ideas for troubleshooting/tinkering:
Try flowing 100% CO2 through the chamber and them subsampling the air from around it on the outside to try and localize the leak.
Try pushing a high flowrate air through the chamber and using a soap bubble solution to see any major leaks.
Look into how the glass windows are attached (glued? pressure fixed?).
Experiment with using a rubber stopper to seal the sides instead of the screws.
Look into making a gasket to better seal where the top screws on.
Trying out an old brass chamber for acorn ants
We made this chamber (~2012) for measuring acorn ant colony metabolic rates, but it’s not a bad size for thermolimit respirometry with a fly. It’s really just a block of brass with two ports, a groove for an O-ring, and a medium sized microscope slide is held on with clamps on top.

Brass chamber
Checking an empty chamber for leaks…
ggplot(c6, aes(x=Seconds, y=CO2_Li7k)) + geom_rect(aes(ymin=-Inf, ymax=Inf, xmin=-Inf, xmax=t6[1]), fill="grey98", alpha=0.1) + geom_rect(aes(ymin=-Inf, ymax=Inf, xmin=t6[2], xmax=Inf), fill="grey98", alpha=.1) + geom_path(size=0.5) + geom_vline(xintercept=t6, col="grey50", size=0.1) + geom_path(size=0.5, col="red") + theme_bw() + ylab(bquote(~CO[2]~'concentration (ppm)')) 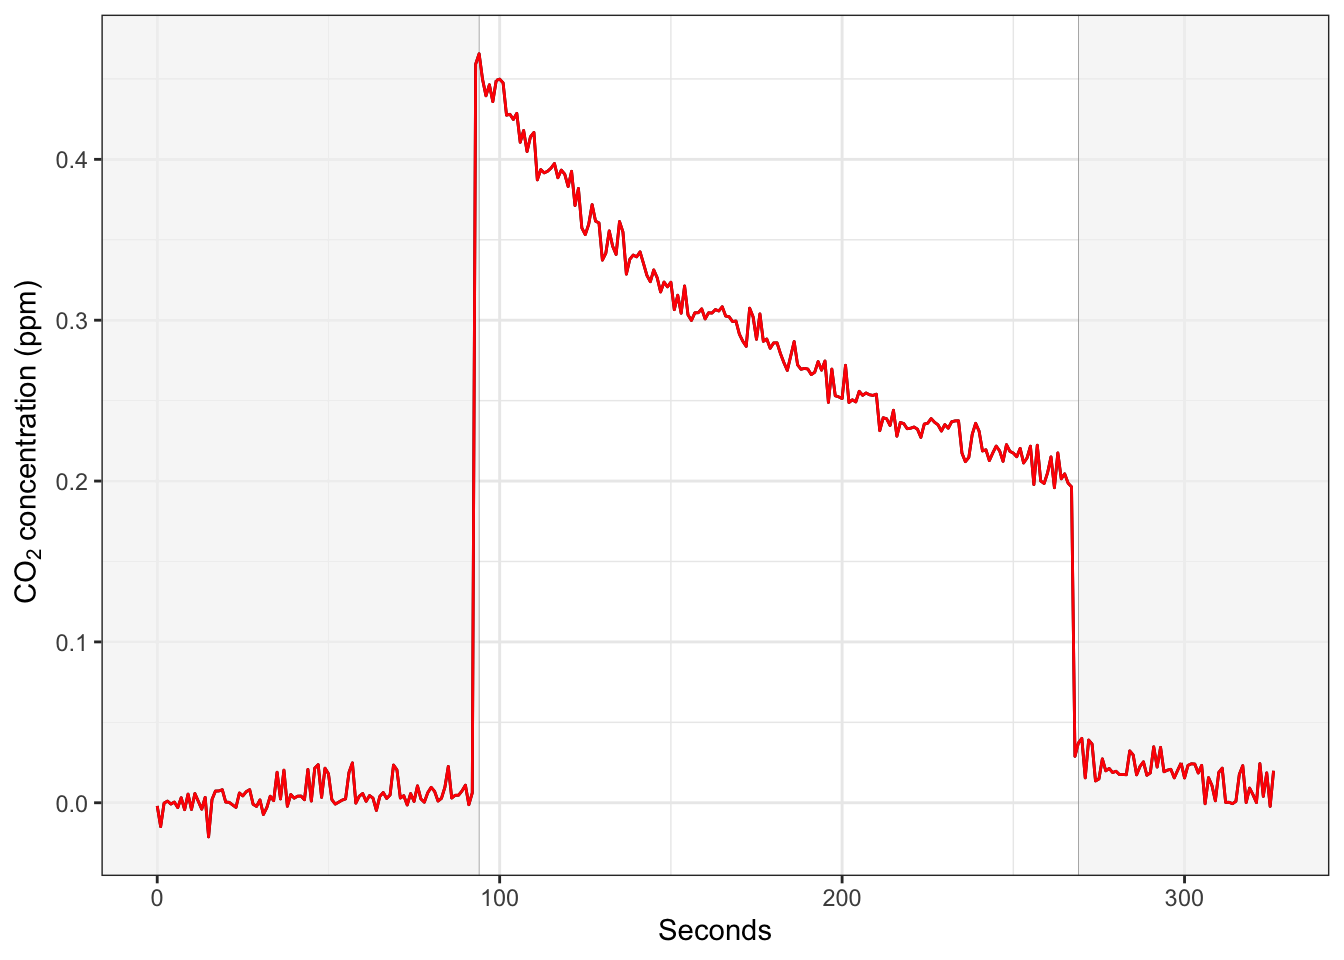
Figure 6: Empty brass respirometry chamber
Not perfect… but possibly low enough that it’s okay to try out.
First run doing thermolimit respirometry

Respirometry bench
Lighton and Turner (2004) used 0.25 degree C per minute ramp. I was in a bit of a rush and went with 0.5 degree C per minute since this was mostly just a proof of principle that it could work.
The subject was a female Drosophila pseudoobscura from a line we keep at 20C. I measured her for a few minutes at 20C, then started the ramp.
ggplot(c7b, aes(x=Seconds/60, y=value)) + geom_vline(xintercept=times/60, col="orange", size=.5) + geom_path() + facet_grid(name~., scales="free") + xlab("Time (min)") + ylab("") + theme_bw()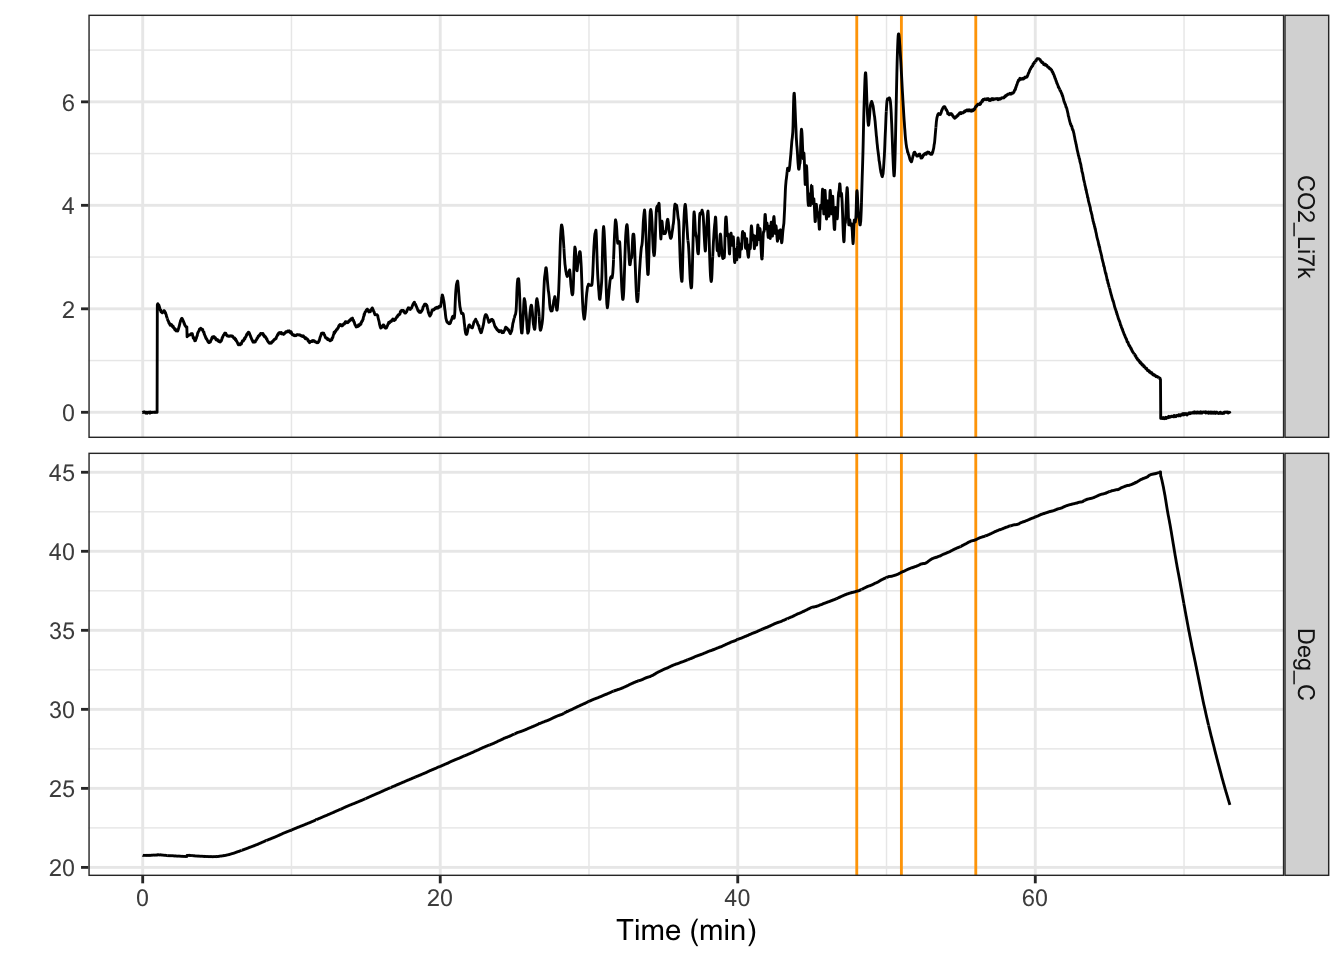
Figure 7: D. pseudoobscura thermolimit respirometry
c7$Deg_C[times]
## [1] 37.469 38.660 40.731
Using the brass chamber, we can’t use the infrared detector for movement, but we can film the fly and could use trackR or other methods to quantify its behavior during a thermal ramp. This run took an hour and unfortunately the video file we recorded was 5 GB in size, but I noted two possible times of interest, that the fly stopped walking around 45 minutes after starting the ramp, it bounced around a bit until 48 minutes and then that was its final position, and then its last visible movement (e.g. twitch) was at about 53 minutes after starting the ramp. Those times are highlighted with orange lines in the plot above, and correspond to the the temperatures 37.5, 38.7, and 40.7C.
Objective CTmax estimate
Following Lighton & Turner 2004…
ads.co2 <- cumsum(abs(diff(c7$CO2_Li7k)))
ctmax <- data.frame(ads.co2=ads.co2, Seconds = 1:length(ads.co2))
ggplot(ctmax, aes(x=Seconds/60, y=ads.co2)) + geom_path() + ylab("ADS of the CO2 trace") + xlab("Time (min)") + theme_bw()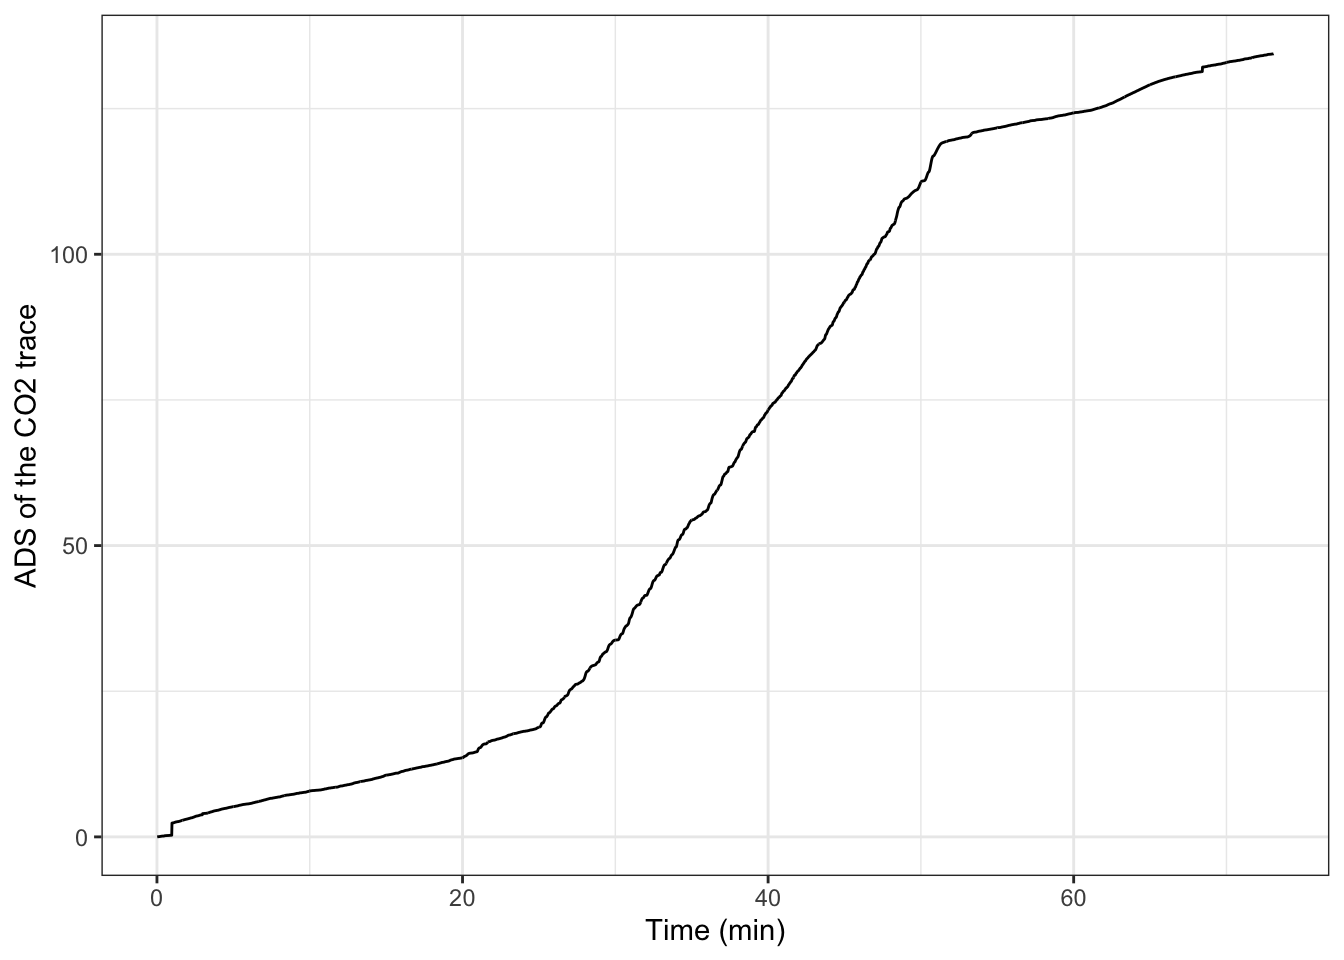
m1 <- lm(ads.co2 ~ Seconds, data=ctmax)
r.df <- data.frame(residuals = m1$residuals, Seconds=1:length(m1$residuals))
ggplot(r.df, aes(x=Seconds/60, y=residuals)) + geom_path() + ylab("Residuals of CO2 ADS fit") + xlab("Time (min)") + theme_bw()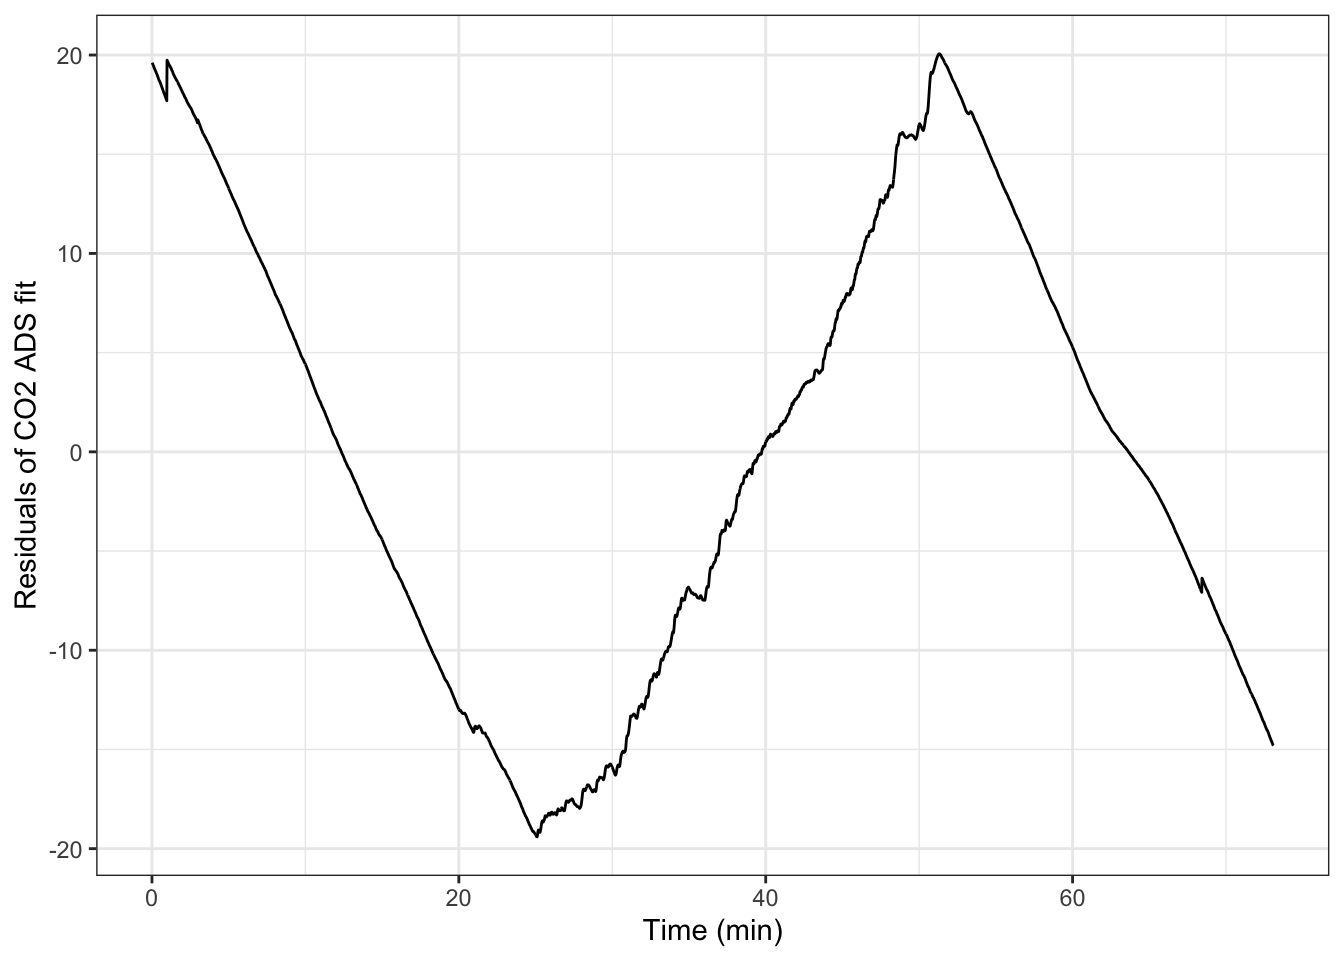
max.resid <- max(r.df$residuals)
r.df$Seconds[r.df$residuals == max.resid]
## [1] 3079
c7$Deg_C[3079]
## [1] 38.8
According to this method, the CTmax of this fly was 38.8 C.